Downsampling
machine-learning tutorial A demonstration of adjusting probabilities after training a model on a downsampled data set. This notebook demonstrates how to adjust the prediction probability output by sklearn Random Forest models after it is trained on a downsampled dataset. It can be applied to ML models in general.
If you have dealt with imbalanced data before, you know an effective technique for training your models is to downsample the majority class. This allows the model to 'see' the separating hyperplane more clearly, improving standard classification metrics like recall, precision and F1. Accuracy is purposely left out because it can be misleading for imbalanced datasets.
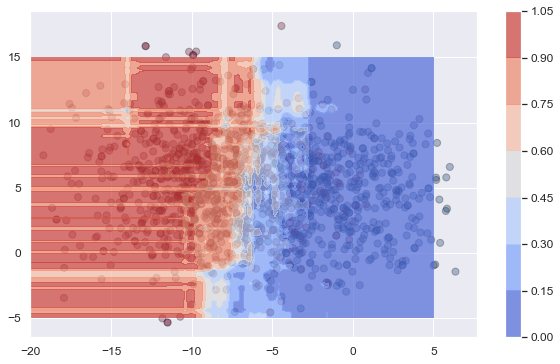
In practical examples, like predicting default outcomes or rare client executions, downsampling shows significant improvement in performance. In the mock-up example in the notebook, the improvement is less obvious, but demonstrates the phenomena well. The baseline model (no downsampling) has F1 of 69% with poor recall (56%) because the hyperplane is pushed to the right. The model trained on downsampled data has F1 of 62% driven by precision. Recall does very well (84%) because the hyperplane is essentially pushed to the right. The probability plots for the downsampled model show how the hyperplane becomes more detailed - there's the appearance of more 'islands' around the minority class.
In many of the practical examples, we typically care more about the probability, and not just the classification scheme. For example, default probability is ultimately used as a feeder to loss models, such as EAD.
The probabilities from a model trained on downsampled data will overstate the minority class based on how the probabilities are calculated and hence need an adjustment. Leveraging this paper, the adjusted probability is expressed as:
$$p=\frac{\beta p_s}{\beta p_s - p_s +1}$$where $\beta$ is the ratio of downsampled majority class to original majority class. As the ratio goes to 1, reflective of no downsampling, the two probabilities are equivalent.
The notebook shows in the last graph of section 2E how much overestimation of the positive or minority class occurs. In this case, where downsampling the majority class by a factor of 5, a 70% unadjusted probability corresponds to 30% probability, effectively switching classification outcomes when the threshold is 50%.
Finally, the simulation in the last section demonstrates the systematic overestimation of probabilities when downsampling the minority class and how the adjustment brings it back in line.