Effects of Sampling
machine-learning tutorial I was surprised to find that a model can generate the same ROC curve, but have drastically different precisions depending on the data set the model is applied to. It became clear why after thinking through.
I was recently working with an imbalanced data set $D$, where the positive minority class represented ~5% of the samples. I down sampled the negative class to create a balanced (50-50 split) data set $D^{'}$. I trained the model on $D^{'}$. For model performance, I generated the ROC curve and the Precision/Recall using both $D$ and $D^{'}$. While the ROC curve was the same for both, the precision dropped from 80% on $D^{'}$ to 10% on $D$. What is the interpretation?
The ROC curve is the True Positive Rate (TPR) plotted against the False Positive Rate (FPR). TPR measures the success rate within the actual positive sample space. FPR measures the rate of errors within the actual negative space. Thus, if the rate of prediction within each class remains the same for $D$ and $D^{'}$, the ROC curve will look similar.
On the other hand, precision measures performance of the positive predictions, mixing the actual postiive and negative sample space. Going from $D^{'}$ to $D$ increases the number of negative samples. If the rate of prediction within each class remains the same, giving a similar ROC curve, then the precision will drop because of the substantially more negative samples. Essentially, the model will be calling many of the new negative samples as positive.
Mathematically
- Assume that $FPR$ and $TPR$ remains the same
- $TN$, $TP$, $FN$, $FP$ is the number of True Negatives, True Positives, False Negatives, False Positives.
- Actual negative class is under sampled by a factor $n$ - this only effects the number of $TN$ and $FP$.
Taking the ratio of the two:
$$ \frac{Precision_{D^{'}}}{Precision_D} = \frac{TP + nFP}{ TP + FP}$$Plugging in numbers to see the impact. Assume:
- $TP \sim FP$, so that $Precision_{D^{'}}$=50%
- n~5 (majority negative class is 5x minority positive class)
Note that $FPR$ and $TPR$ will remain the same independent of sample size because the $n$ will cancel in the numerator and denominator (not shown).
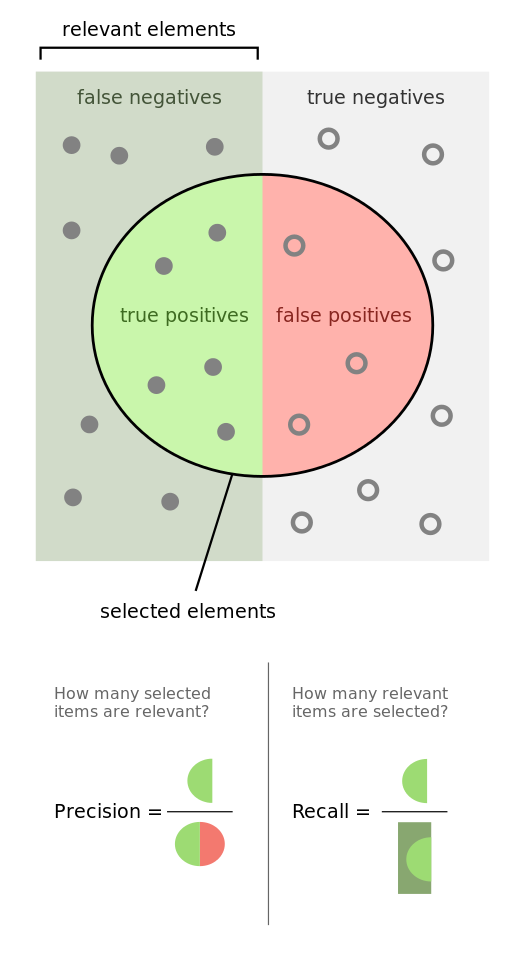
Quick Reference on Precision/Recall (wiki)