Beer Nutrition
data-science project Introduction
I like beer and I like data, so it is natural that I would love to play with data on beer. I like the abundance of flavor in beers with higher ABV, but began wondering: at what nutritional cost? Extra calories, carbs, both? It’s clear one can pick a Michelob Ultra if they were trying to minimize calories, but lets face it, compared to an IPA, that’s like a paper fan compared to an AC unit.
Data Description
I found some beer nutrition data online to start the analysis with. Ultimately, I would like to build a scraper to capture some more data. There are three attributes I am interested in: Calories, Carbohydrates, and ABV %.
Results
A factor plot is a convenient way to get a quick glance at the relationships between the three attributes (Figure 2). It shows the linear relationship between them, which is expected because they are intimately related. A single carbohydrate is a calorie. In fact, Google says that one gram of carb is ~4 calories. Figure 1 shows this in more detail. The slope of the regression line implies slightly more calories per carb in beer: ~6.7 cals per gram carb. The fit is skewed by the “skinny" beers with under 10 grams of carbs, where the first few carbs don’t seem to be make a caloric difference. This is probably due to engineering trade-offs. The <5g carb beers are probably missing something that gives the 5-10g carb beers some taste. The intercept is ~69 calories, indicative of some minimum non-carb contribution to the amount of calories.
Other interesting relationships are available too because of the linear relationship. ABV is typically the most available stat on the beer label. From this, you can estimate calories and carbs using these handy rule-of-thumb calculations:
- Multiply ABV% by 30 and to get total calories.
- Multiply ABV% by 3 and to get total carbohydrates.
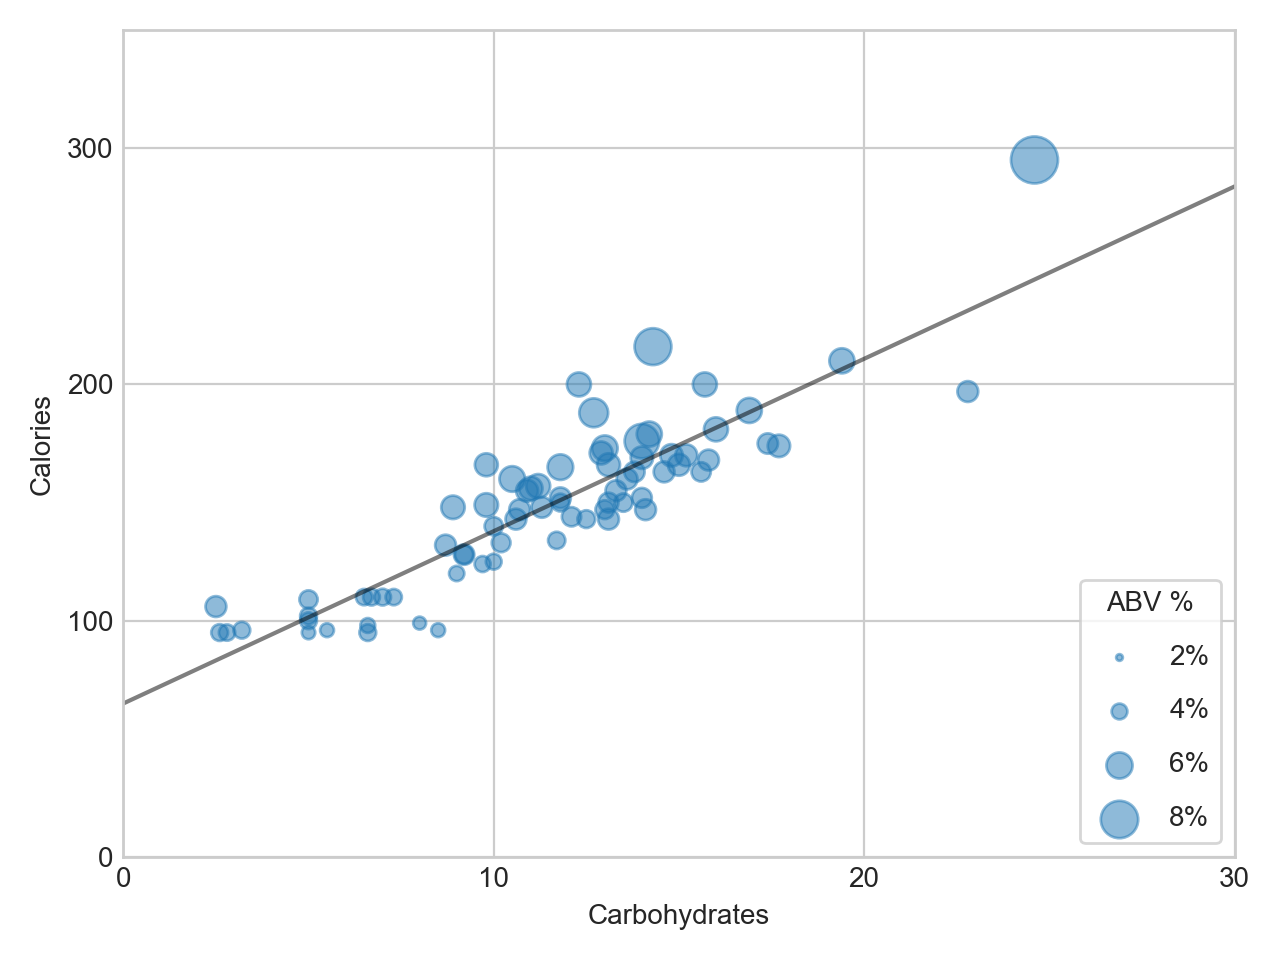
Figure 1: Calories, carbohydrates and ABV % are all intimately related. Data on 76 beers reveals some useful rule of thumb calculations you can use to make estimates. For example, multiply your ABV % by 25 to estimate the number of calories in your beer.
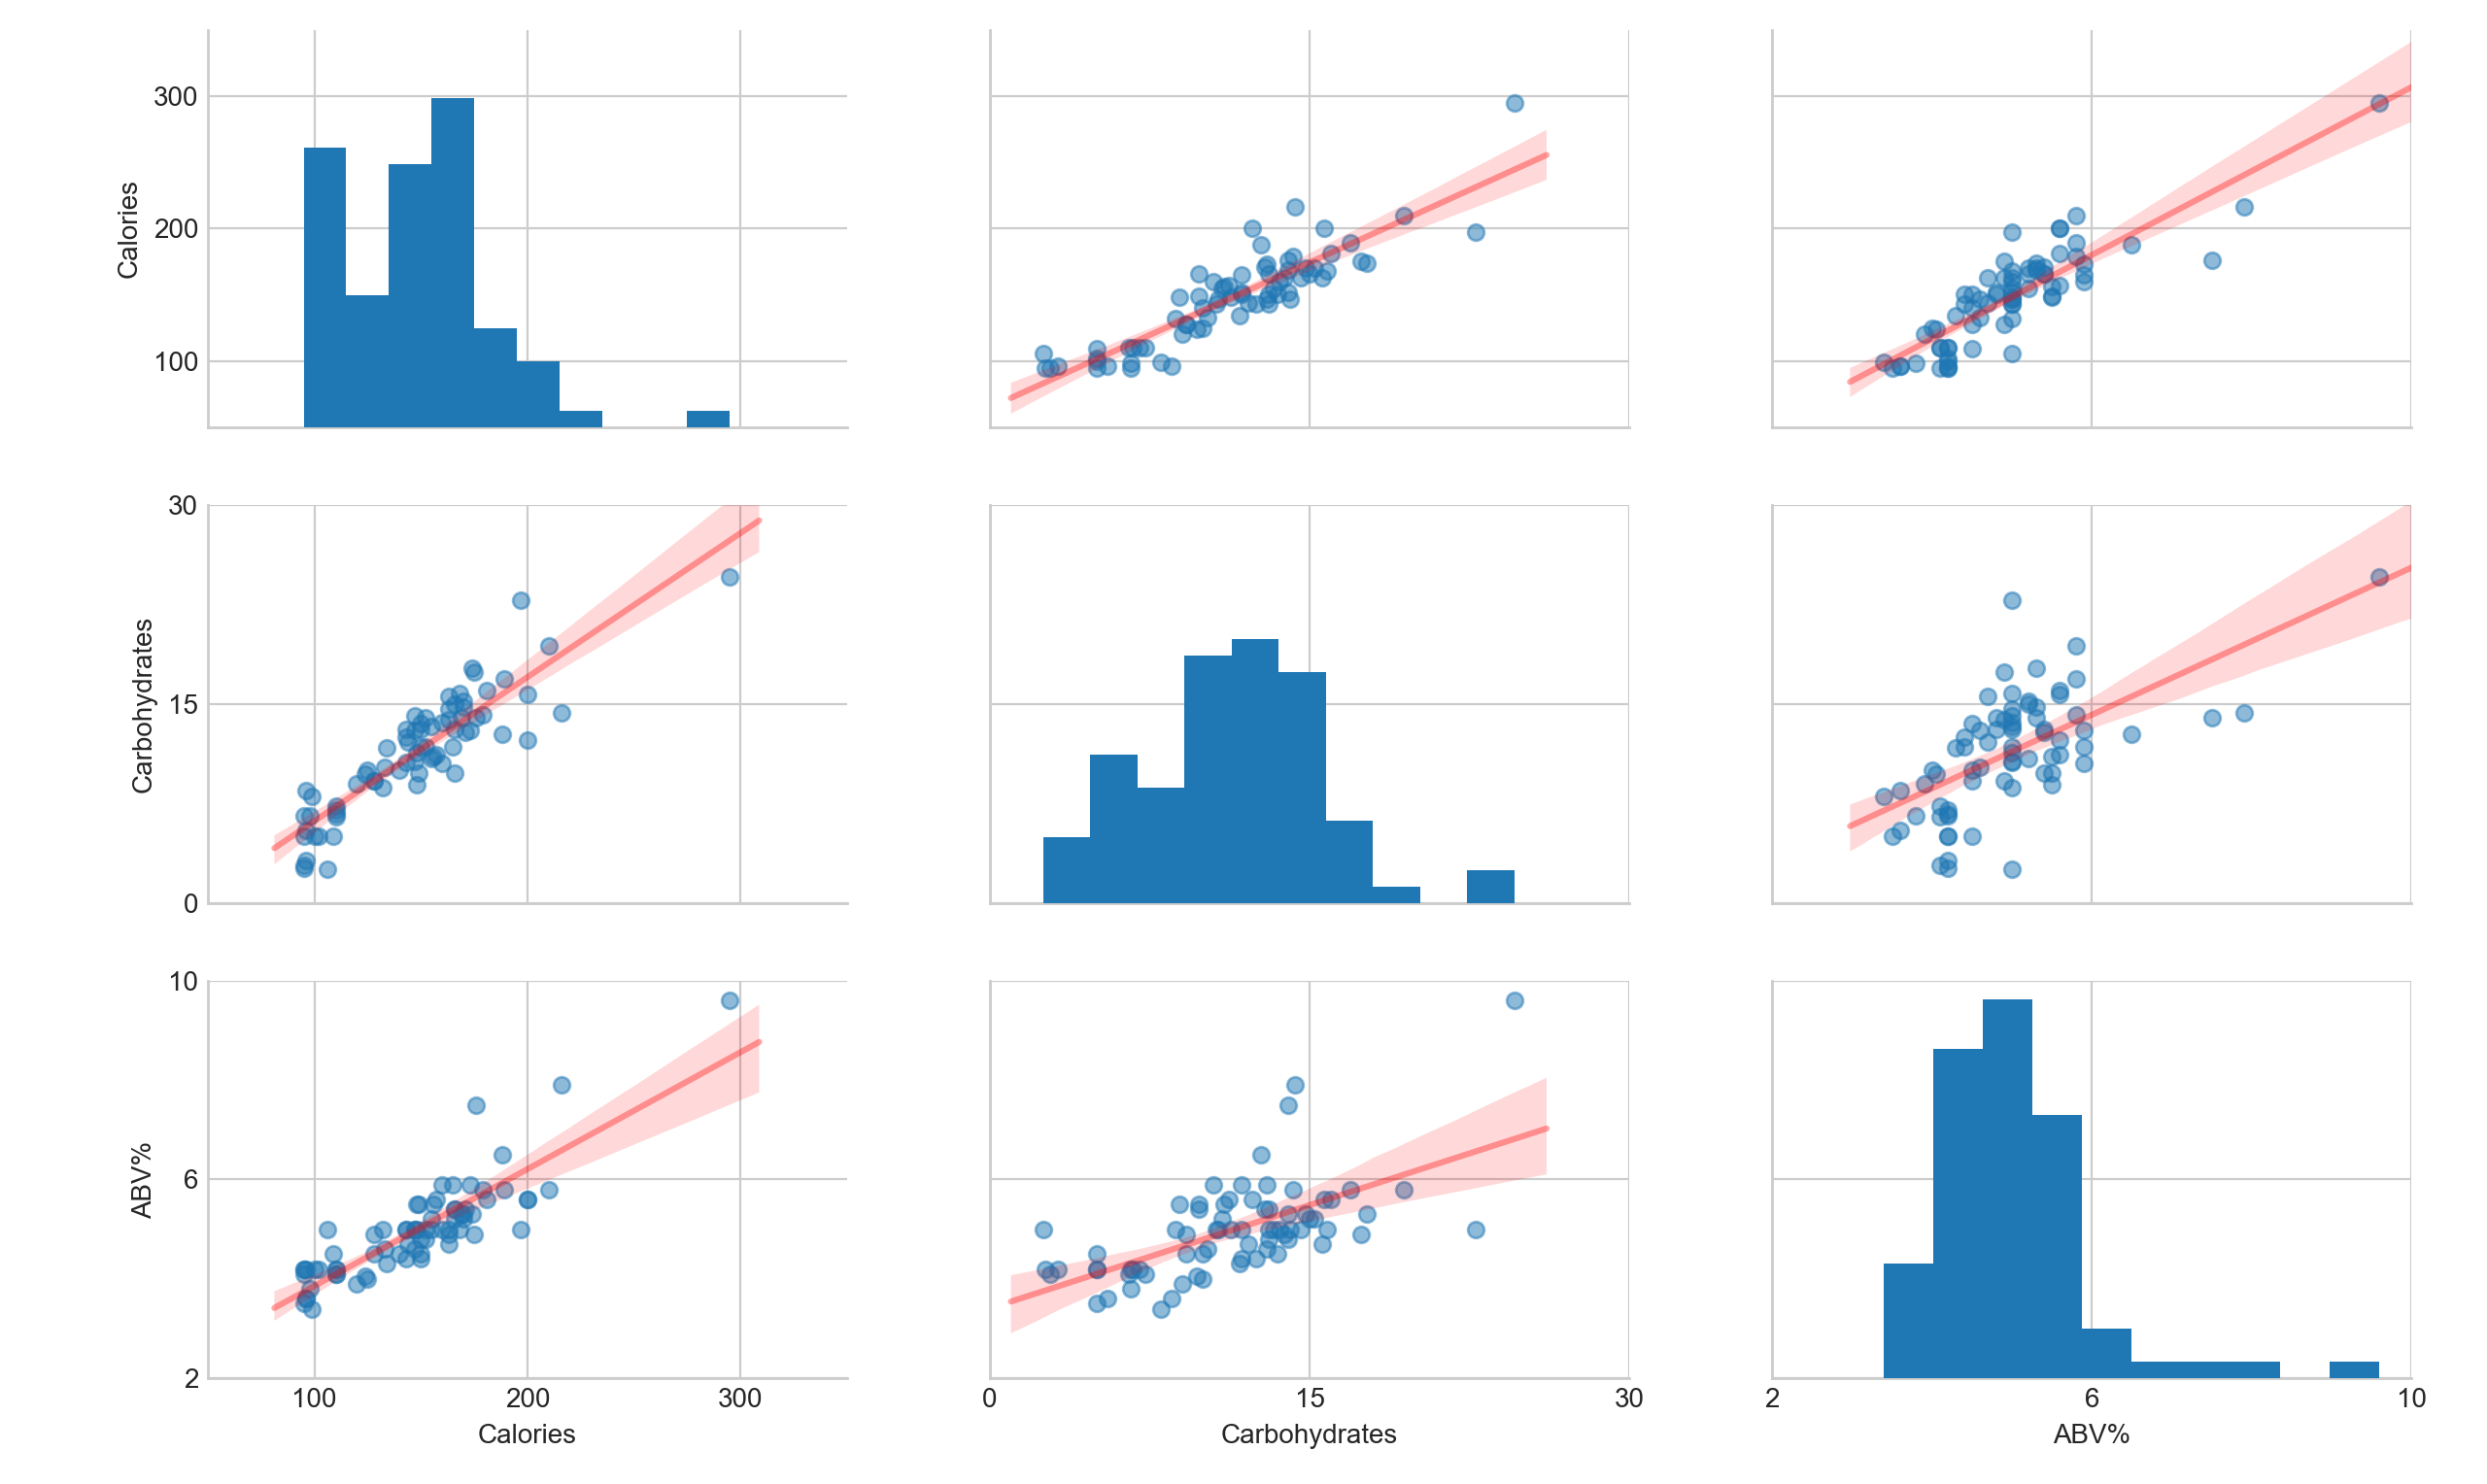
Figure 2: Factor plot between ABV %, calories and carbohydrates. Red line is a regression with shaded area showing 95% confidence interval. There is a strong linear relationship between these correlated variables. The outliers are more likely from bad/false data.