Rush Hour at Penn Station
machine-learning project Introduction
New Jersey commuters are all aware of the third-world-esque brutality that ensues when the evening monitor at Penn Station posts their train’s track number. Entrances onto the tracks were designed for significantly less people. The urgency to get on the train brings out the Mike Tyson in the sweetest old lady with a cane; a book bag to the face is a standard tactic to make room. While being kicked from the back and inhaling the scent of the sweaty gentleman in front of me, it occurred to me: there has to be a better way. Can I predict the track for my train prior to the posting? Then, while I sit comfortably in my seat having a train beer, most passengers would still be scrumming with their NJT compatriots to get on the platform. Queue the Dr. Evil laugh.
Get the data
I sensed there was some method to the posting rationale from observing the way people hung out by certain tracks. I took my data obsession to the next level by writing a Python script to scrape data every minute from the posting website using Amazon Web Services. After collecting data for over a month, I put together some analysis that I hope you find enlightening, more to come.
Data Description
There are 4 main train lines that have service to Penn Station: Montclair-Boonton, Morristown Line, Northeast Corridor and the North Jersey Coast. In the graphs below, the plots use the same color as the posting site (eg cornflower blue for North Jersey Coast). The focus is on my particular interest: weekday rush hour defined as Monday through Friday 4p-8p.
Are the trains on time?
Before predicting track postings, I explore a key part of passenger frustration: track “announce” times. On average, rush hour trains are announced ~10 minutes prior to planned departure. If “on time” could be measured by having an announced time prior to departure time, only 3% would be late, seemingly a small number. However, this isn’t a good metric for measuring "on time".
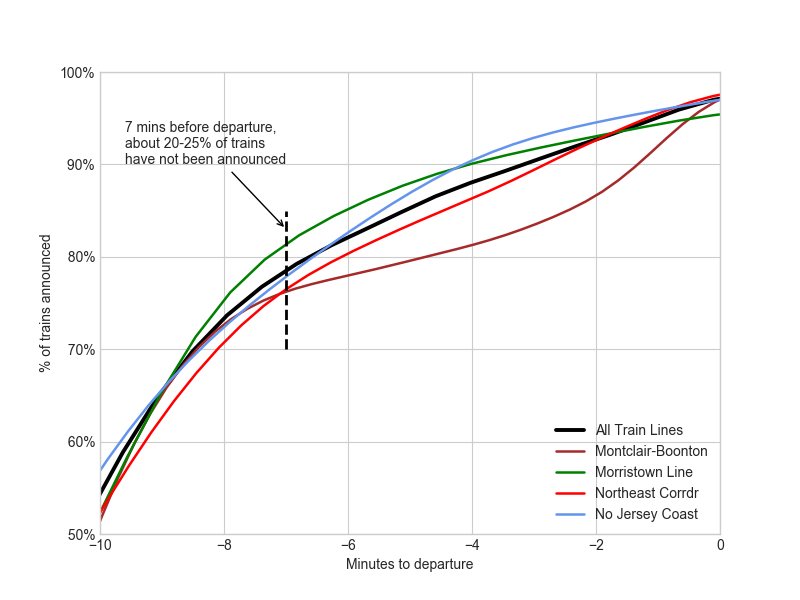
Assume that NJT gives 7 minutes from track announcement to actual train departure from Penn. In this case, 20-25% of rush hour trains have not been announced and can be assumed to be late leaving Penn Station (see dotted line). The figure below shows that although the average rush hour train is announced 10 minutes before departure, there is a fair amount of trains that aren’t announced. Alas, for one of the trains I take, Montclair-Boonton, 20% of trains remain unannounced until 3 minutes before departure.
Distribution by train line
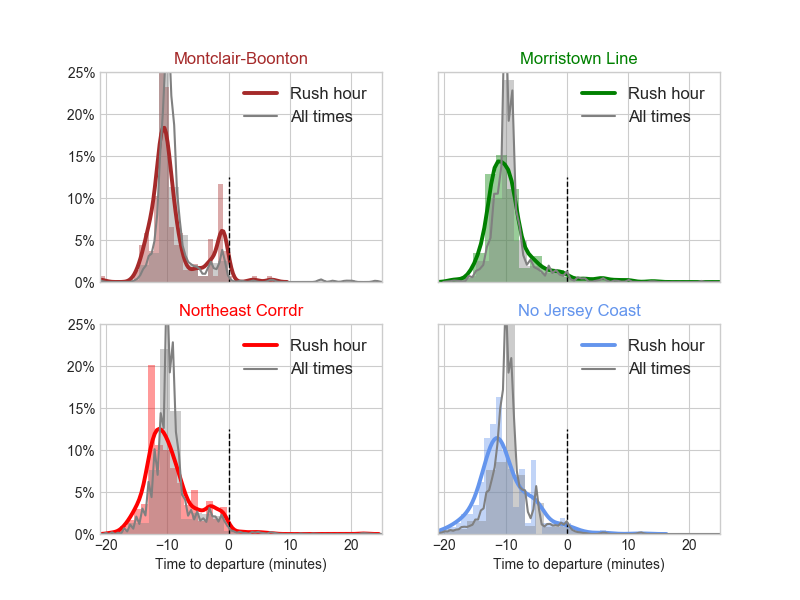
The next figure shows a histogram and kernel density estimation of announce times, by train line. These explicitly show clear bumps closer to the departure time (black dashed line is departure time), in the 2-7min range. For Montclair-Boonton, the bump right before departure time (0th minute) is interesting - I wonder if there is some incentive or penalty around how NJT officials keep their lateness metrics. From a commuter perspective, late announcements are cruel because 1) there is an accumulation of passengers waiting to board 2) there is an increased sense of urgency - people arriving as the train is announced feel their train is about to leave and push a little more 3) it disallows people who are a minute or two late to get on a train that is still on the tracks (NJT erases the train from the board after departure time if it has been announced).
Where do you stand?
Where should one stand, literally - does this data allow one to predict which track entrance you should stand at? To build a model, we make some assumptions on how the trains operate. Assume each train is assigned a primary track that it should leave from, and if for some reason, they cannot leave from that track, then there is a secondary track.
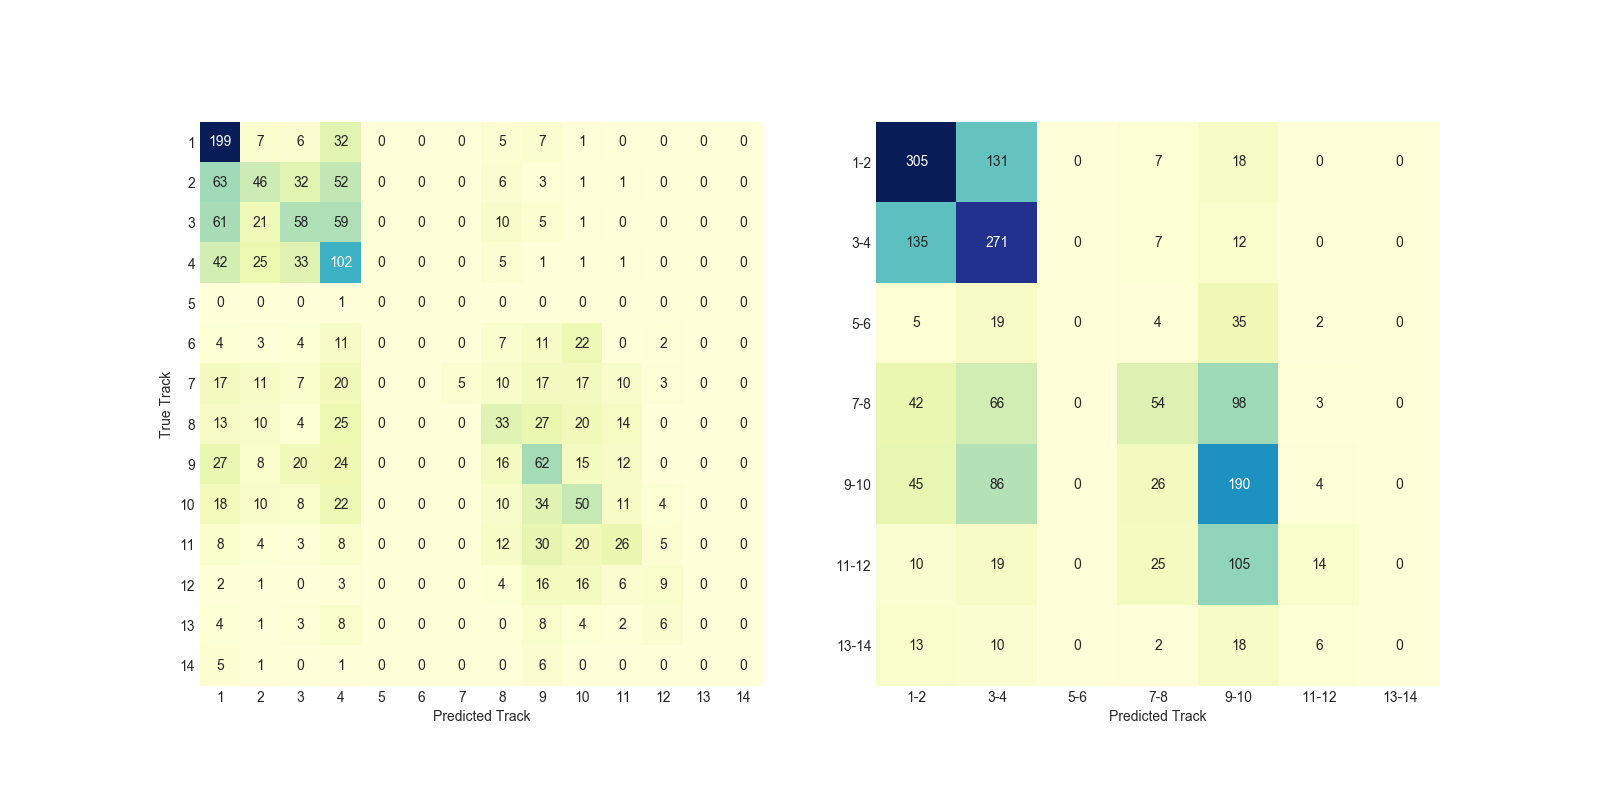
First pass: Naive Bayes Classifier, predicting on train number only
Training and testing a model on the same data is a biased way of seeing how well it works. However, it’s good for a first pass. The first test uses a Naive Bayes Classifier on training data consisting of a train number and track number. The figure below shows a confusion matrix. The left side is by individual tracks and shows some structure, for example: trains that go to Track 2 get predicted to track 1,3&4. Since Penn Station is designed in such a way that consecutive tracks have the same entry way for passengers, these can be grouped (right side). Looks like one can stand in a particular area (between the doors for Track 1-2/3-4) and have a good success at being the first ones in. The accuracy by train line is listed in the table below. Not surprising that the train that announces track really late cannot be predicted well. This leads to the next pass at modeling the prediction: adding features that take into account that each train is affected by each other, since an occupied track does not allow a train to dock at its primary track.